NSW Logo Reconnecting River Country Program inundation extent web viewer

Murray River: Hume Dam to Yarrawonga Weir

Welcome to the Reconnecting River Country Program (RRCP) inundation interactive map. The map provides access to the program's modelled outputs showing potential inundation for the flow rates being investigated.

This app focuses on the Murray River between Hume Dam and Yarrawonga Weir. The default flow option displayed in the app is 25,000 ML/d at the Doctors Point gauge, which is the current operational limit.

What's new

The interactive map has been updated to simplify and improve the inundation information presented. The updates include:

April 2024
  • New satellite only basemap added
  • Satellite imagery colours enhanced
March 2024
  • New Quick Zoom functionality
  • Symbology updates
October 2023
  • New basemaps sourcing data from NSW Spatial Services which includes property boundaries
June 2023
  • 35,000 ML/d flow limit option added, as modelling has become available
Feb 2023
  • Model zones merged to provide seamless mapping for each project area
  • Modelled levees and embankments have been added to the mapping
  • Modelled flows at gauges are now provided in table form to allow easier viewing
  • Gauge board diagrams were added for some gauges. The remaining gauges will be added in the future once the analysis is complete
  • Additional text was added to the banner to describe the potential frequency, timing, and duration of flows

Future model revisions

The NSW Department of Climate Change, Energy, the Environment and Water (DCCEEW) is continuing to seek feedback from landholders on the accuracy of the mapping and also continuing to check the models against flow events in recent years. This work will lead to refinements in the modelling and mapping over time. Past revisions to the modelling are listed above and any future revisions will also be identified here.
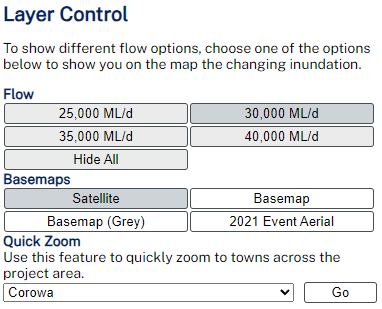
Using the app

To show different flow options, choose one of the layers and it will show you on the map the changing inundation.

Layer control

You can also zoom and pan around the map using your mouse and the included tools:

Zoom In

Zoom out

Search

Default view

Base Maps

Base map options can be toggled in the Layer Control and can be displayed below inundation extents:

Satellite
Composite satellite imagery represents a collection of recent satellite photographs captured and delivered in high resolution.

Basemap
A cartographic layer from OpenStreetMap representing physical features on the ground such as roads, rail, localities, national parks and other features across the landscape.

2021 Event aerial photography
Aerial photography of a recent natural flow event between August and December 2021. This imagery was only captured for some areas of the program by the NSW DCCEEW.

Bridges

The mapping shows the extent of inundation, including the presence of water under road, highway and rail bridges. For bridges, the mapping does not accurately indicate inundation. The mapping product is overlain over aerial imagery which may appear to show bridges as being overtopped by water, but may represent water under the bridges.

More information

For more information on the program, please refer to the Reconnecting River Country Program Information hub on the DCCEEW website.

NSW Logo
Murray River: Hume Dam to Yarrawonga Weir
?
⯇
⯆

Layer Control

To show different flow options, choose one of the options below to show you on the map the changing inundation.

Flow
flow_controls
Basemaps
basemap_controls
Quick Zoom
Use this feature to quickly zoom to towns across the project area.

No scenario selected
Scenario: selected_flow at Doctors Point - Current flow limit

Legend

Upper limit of inundation extent for flow option1
More typical inundation extent for flow option2
Embankment/levee
Reference gauges3
A legend for the topographic basemap used on this map can be accessed via this link
Details

Please select a scenario from the above for specific details

This option is for a flow limit of selected_flow at Doctors Point, which is the current flow limit (base case).

The mapping shows the following extents:

  • upper limit of inundation for this flow limit option (light blue)1
  • an inundation extent more typically experienced when these higher environmental flow deliveries are made (dark blue)2

These extents show the inundation outcomes for the flow options being investigated vary depending on catchment conditions and would be less than the modelled upper flow limit in most cases.

1The upper limit inundation extent assumes catchment conditions are wet (with low infiltration and evaporation losses) and flows are held at this level for an extended duration, substantially greater than the normal duration environmental flow releases would occur. Environmental flow releases causing this inundation extent across the full length of the river system would be infrequent or rare.

2The more typical inundation extent shows an inundation extent more frequently experienced under this flow limit option, under more typical catchment conditions and environmental flow release durations.

Flow rates and gauge heights

Estimated flow rates and gauge heights for the upper limit inundation extent across this project area are shown in Table 1, below.

Table 1: Flow rates and gauge heights

Frequency, timing and duration

The proposed frequency of managed environmental flows under the Reconnecting River Country Program (i.e., flows greater than 15,000 ML/d and up to the upper flow limit) would vary over time depending on water availability, climate and ecological conditions.

Over the long-term, it is anticipated these higher environmental flow deliveries would occur on average about four to five years per decade, comprising of some smaller events and some larger events up to the flow limit.

Flows would include some new events and some events extending the duration of existing unregulated events using water for the environment. They would not occur during extreme wet conditions when there is elevated flood risk.

Most of the higher environmental flow deliveries would occur from August to October. Occasionally, and when conditions are appropriate, deliveries might occur slightly earlier in June to July, or slightly later in November.

Deliveries in November would be infrequent and would mostly involve adding to an existing unregulated flow event to improve environmental outcomes or manage hypoxic blackwater risk.

The duration of the higher environmental flow deliveries would be up to seven to 21 days at the peak flow rate. In some years, this would be the upper flow limit, while in other years smaller flows would be delivered. This would be followed by a gradual reduction back to background flow levels.

Occasionally, lower flows (e.g., 15,000 to 30,000 ML/d) may be delivered for up to 30 days to support the health of low-lying wetlands and waterbird breeding events.

Inflows from the Ovens and Kiewa rivers

Environmental water releases from Hume Dam will continue to consider inflows from the Kiewa River to ensure the agreed flow limit at Doctors Point is not exceeded during environmental releases. Similarly, river operators will continue to consider inflows from the Ovens River, in combination with Murray flows (Hume Dam releases combined with Kiewa River inflows), to ensure the agreed flow limit downstream from Yarrawonga weir is not exceeded.